
Hackathon 0x09 – eBPF
At Intersec, we love new technologies that can improve our working tasks, our code, and because it is fun! During Hackathon 0x09, I tested the possibility to use BPF for tracing and debugging our C codebase.
What is BPF?
In the beginning, BPF was a technology used for packet
filtering
1.
For example, when using the command tcpdump -i lo arp, BPF is
used to filter ARP packets on the loopback interface. BPF has since been
enhanced. The BPF instructions set was extended in Linux kernel 3.15 and was
called “extended BPF” or eBPF. Today “BPF” could be defined as the technology
that uses a set of tools to write and execute eBPF code.
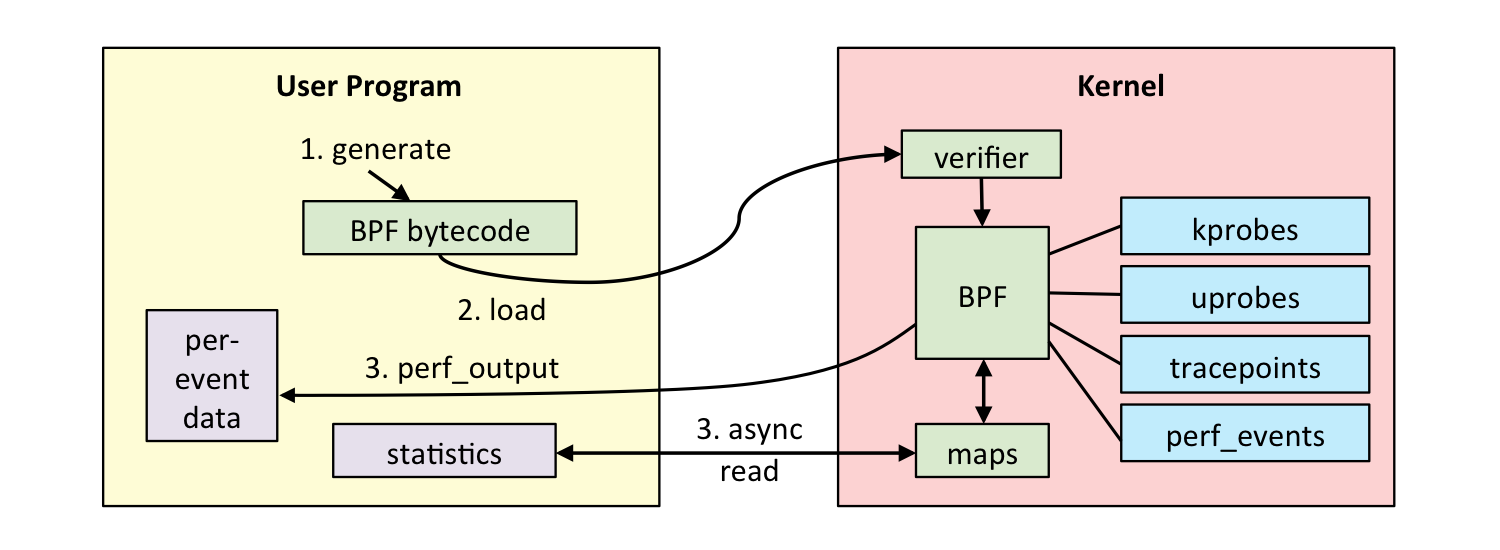
So technically speaking, BPF is an in-kernel virtual machine that runs user-supplied programs inside the kernel. The instructions are verified by a BPF verifier that simulates the execution of the program and checks the stack state, out of range accesses, etc. The eBPF program must finish in a bounded time2 so this is not Turing complete. The program is rejected if the verifier considers it invalid. The virtual machine includes an interpreter and a JIT compiler that generates machine instructions.
The eBPF program can be written in C. LLVM Clang can compile C code into eBPF bytecode and it can be loaded with the bpf syscall 3. Therefore, writing a single BPF program could be complex. Fortunately, we have the BCC frontend4. BCC is a set of tools to write, load and execute eBPF programs with Python bindings.
What is it used for?
Another way to explain BPF is that this technology allows us to attach and run small user-supplied programs on a large number of kernels, user applications, and libraries. It can gather application information, send events, aggregate statistics, and more. It is still used in networking for filtering packets and processing packets in the driver of the NIC (XDP5). It is also used in security (seccomp), DDoS mitigation… and observability.
Observability is a way to get insights from the system and the applications, by providing tracing or sampling events. This is what we want to achieve in this hackathon.
There is already a lot of tools available for this purpose: gdb, log, rr6, strace… BPF has some advantages. It is lightweight and has little impact on the execution, it is programmable and the BPF verifier guarantees the safety of the system or the application. BPF uses static or dynamic instrumentation and can gather information from the whole system, so it can be executed on libraries, applications, and kernel during runtime. Therefore, BPF is different and it could be considered as a complementary tool for the investigation.
Purpose of this hackathon
The goal of this hackathon is to try the usability of BPF in our ecosystem.
In this hackathon, I used BPF in three different ways: with USDT (Userland Statically Defined Tracing), kprobe (kernel probe) and uprobe (user probe) by using bcc frontend. As a playground, I used one of the Intersec internal applications: a highly performant distributed shard-based database.
The database (db) can run on multiple hosts but for convenience and for the exercise, we run three instances of the db on the same host.
Our first BPF program with USDT
User Statically-Defined Tracing is a convenient way to instrument user-space code and it allows tracing in production with low overhead. However, a tracing point must be inserted and maintained in the code. There are several ways to insert a USDT probe, for example, by using systemtap7 . I used the header provided in bcc lib that I incorporated in our common lib 8 for the occasion.
Our db can create ‘snapshots’. So, Let’s try to follow the snapshots by using a BPF program. During a snapshot, the data of each shard is persisted into files. This is the only modification to the code:
+#include <lib-common/usdt.h>

@@ -740,10 +741,14 @@ uint32_t db_shard_snapshot(db_shard_t *shard);
res = qps_snapshot(shard->qps, data.s, data.len, ^void (uint32_t gen) {
    int sid = shard->sid;
    struct timeval tv_end, tv_diff;

+   /* Static tracepoint. */
+   USDT(db, snapshot, sid);
+
    lp_gettv(&tv_end);
USDT first argument (db) is the namespace, the second argument (snapshot) corresponds to the name of the USDT, and the last argument sid will expose the shard id to the BPF program. At Intersec, we use a rewriter to provide a kind of closure in C9, the closure block is defined by the caret character (^).
A static tracepoint has low overhead. Indeed, here it adds only a nop operation to the code.
  0x00000000009267ec <+63>: mov 0x18(%rax),%eax
  0x00000000009267ef <+66>: mov %eax,-0x14(%rbp)
+ 0x00000000009267f2 <+69>: nop
  0x00000000009267f3 <+70>: lea -0x50(%rbp),%rax
  0x00000000009267f7 <+74>: mov %rax,%rdi
  0x00000000009267fa <+77>: callq 0xbeed95 <lp_gettv>
More importantly, it adds information to the elf header of the db binary.
> readelf -n db

[...]
Displaying notes found in: .note.stapsdt
Owner Data size Description
stapsdt 0x00000032 NT_STAPSDT (SystemTap probe descriptors)
Provider: db
Name: snapshot
Location: 0x00000000009267f2, Base: 0x0000000000000000, Semaphore: 0x0000000000000000
Arguments: -4@-20(%rbp)
Now, I can write our first eBPF program in C:
BPF_HASH(snapshot_hash, struct snapshot_key_t, u64);

int snapshot_probe0(struct pt_regs *ctx) {
    struct snapshot_key_t key = {};
    int32_t sid = 0;

    /* Read first argument of USDT. */
    bpf_usdt_readarg(1, ctx, &sid);

    /* Send information to Userspace. */
    bpf_trace_printk("shard :%d\n", sid);

    /* increment value of map(key) */
    key.sid = sid;
    snapshot_hash.increment(key);
    return 0;
}
It is quite simple: it reads the first argument of the USDT tracepoint and sends back this information with a common pipe. BPF provides data structure (maps) that allows data to be used in the kernel and/or the user space. We use a map to count the snapshot occurrences for each shard id.
With the BCC frontend, attaching and executing the probe is as simple as these 3 lines in a python script:
usdt = USDT(path=<path_to_the_binary>)
usdt.enable_probe(probe="snapshot", fn_name="snapshot_probe0")
bpf = BPF(text=<bpf_program.c>, usdt_contexts=[usdt])
We need the path of the binary or the process id to insert the eBPF
program. What the kernel does is to replace the nop by
a breakpoint int3. When this breakpoint is hit, the kernel
executes the eBPF program. Then, when we trigger snapshots in the db,
the python script polls events and prints the collected information:
Tracing USDT db::snapshot... Hit Ctrl-C to end.
PID    PROG             TIME             SHARD ID
12717  db               4130.496204000   4
12546  db               4130.591365000   3
12546  db               4131.376820000   3
12717  db               4131.401658000   4
12717  db               4131.595490000   6
...
As you can see, when I provide only the path to the binary, BPF is able to trace all the processes that use this binary.
We can also read the map and display a summary:
COUNT SID
    1 "6"
    2 "17"
    3 "4"
    3 "3"
kprobe
kprobe is a powerful tool to gather system information. kprobe allows us
to instrument dynamically nearly any kernel function without running the
kernel in a special mode, without rebooting or recompiling the kernel! The
instrumentation sequence is the following: the target instruction address is
saved and replaced by an int3 or a jmp instruction.
When one of these instructions is hit, the related eBPF program is executed;
then the saved instructions are executed and the application instructions flow
is resumed. It is also possible to instrument when the kernel function
returns, this is called kretprobe.
So let’s try with our db. When the db is snapshotting, files are written
somewhere. Thus, the db will create new files, and I can guess without
checking our code that it will probably use open syscall. So, we can trace
the do_sys_open kernel function which is the endpoint of open
syscalls. My new eBPF program will instrument the do_sys_open
function entry (kprobe) and the function return (kretprobe).
During the function entry, the eBPF program will store, for each call, some
information (filename, flags, process details…) on a specific map. During the
function return, if the do_sys_open function is successful,
the information contained in the map for this call is sent to a BPF ring
buffer and printed by the python script.
bpf.attach_kprobe(event="do_sys_open", fn_name="open_entry")
bpf.attach_kretprobe(event="do_sys_open", fn_name="open_return")
bpf["events"].open_perf_buffer(print_open_event, page_cnt=64)
Here, we also used the previous USDT tracepoint along with the
do_sys_open tracing, the results are printed together:
Tracing USDT db::snapshot... Hit Ctrl-C to end.
PID    PROG    TIME            FD  SHARD_ID   FLAGS    FILENAME
12546  db      4099.361961000      3
19793  db                      6              00100101 .lock
19793  db                      4              00100302 00000000.00000009.qpt
12546  db                      7              00101102 01000007:0000000000000071.log
...
We can note that BPF can trace new db processes that are not
present when I attach the BPF program. The file persistence is done by a
forked process.
uprobe
BPF can also dynamically instrument user application or libraries. It works the same way as kprobes. It traces a file. So all processes, backed by this file, which are already running and all future processes that will use this file, will be tracked automatically. Thus, if you instrument the libc:malloc function, you will end up tracing every process and each new process that will use malloc of this libc in the system. This is maybe not the smartest move because it will trigger a lot of events, but you will be like an omniscient demiurge in your Linux environment. It is safe to use. If you can trace the kernel you can trace any application.
This time, we used argdist
10
which is a wrapper that can write, attach the BPF program, and handle
events in one line (see also bpftrace11). The log rotate
function is triggered during the snapshot sequence, as its name indicates:
it will rotate the binary log.
argdist.py
   -i 5                                        # print every 5s
   -C'p:                                       # trace function entry
       ./db:                                   # binary path
       db_log_rotate(db_shard_t* shard):       # function prototype
       uint32_t,uint64_t:                          # values types
       shard->version.epoch,shard->version.version # print these values
       #epoch'
       -z 32
   -I'r9y.h'                                   # function header

...

[11:57:07]
epoch
        COUNT      EVENT
        1          shard->version.epoch = 16777220, shard->version.version = 422
        1          shard->version.epoch = 33554441, shard->version.version = 150
...
The BPF program traces all calls to the db_log_rotate
function, and prints shard versions. It is simple and easy to use, I needed to
use a sham header because of some compilation issues between the kernel
headers and our lib-common. I try to handle the compatibility issues but due
to lack of time, this will maybe be done on the next hackathon!
Dynamic Instrumentation is quite powerful because you can trace all functions in your application without modifying the code. However, it requires debug information and it can suffer from the interface instability. The interface may not exist depending on the version of the binary or the function may be inlined… Nevertheless, it is still very useful because with BPF you can do more than just print values as I did.
Conclusion
This hackathon was the occasion to use BPF and test the possibility to trace our base code. It was relatively easy, powerful and fun to use.
However, although it does not require, nowadays, the cutting edge of the kernel version (> 4.X), some distributions12 are still not compatible with BPF.
What still remains to be done is the compilation of the eBPF program for compatibility with our lib-common headers and especially with our IOPs13.
Romain LY
- http://www.tcpdump.org/papers/bpf-u could is large and csenix93.pdf [↩]
- Kernel 5.3: bounded loop support: https://lwn.net/Articles/794934/ [↩]
- http://man7.org/linux/man-pages/man2/bpf.2.html [↩]
- https://github.com/iovisor/bcc [↩]
- https://www.iovisor.org/technology/xdp [↩]
- See the post Improved debugging with rr [↩]
- https://sourceware.org/systemtap/wiki/AddingUserSpaceProbingToApps [↩]
- https://github.com/Intersec/lib-common [↩]
- See the post Blocks rewriting with clang/ [↩]
- https://github.com/iovisor/bcc/blob/master/tools/argdist.py [↩]
- https://github.com/iovisor/bpftrace [ ↩]
- https://www.redhat.com/en/blog/introduction-ebpf-red-hat-enterprise-linux-7 [ ↩]
- See the post Intersec Object Packer part 1 : the basics [ ↩]