Hackathon 0x09 – Monitoring with Prometheus/Grafana
Objective
In our products, we use a home-made technology called QRRD (for Quick Round Robin Database) to store monitoring metrics (system CPU/memory monitoring, incoming event flows, …).
QRRD (which is written in C) was actively developed between 2009 and 2013, but we have not been investing in it since, so it has not evolved anymore. And even if this is a really great technology (especially in terms of scaling and performances), it has the following drawbacks:
- The associated visualization tools are really old-fashioned, and not convenient at all.
- Its data model (which is really close to the graphite one) is limited compared to key-value data models; the difference between both is well explained here.
- Its support of alerts is very basic and their configuration is complex.
- It is old and therefore harder and harder to maintain (or develop).
With this hackathon subject, our team wanted to explore the possibility of using more modern, standard, fancy and open-source tools as a replacement of QRRD for monitoring our products. We decided to try using the Prometheus/Grafana couple:
- Prometheus is an open-source time-series database, originally built at SoundCloud, and now widely used.
- Grafana is an open-source visualization and alerting system that can connect to several databases, including Prometheus. It is fancy, powerful and easy to use.
What was done
The first step consisted in trying to send statistics to a Prometheus server from the core binaries of our products. Since our core product is coded in C, we had to use this unofficial third-party C client library. We first had to integrate this library to our build system, and write some helpers around it to make it easy to declare Prometheus metrics in any daemon of our products.
Then, we integrated Promethus itself in our products, as an external service (i.e. a non-Intersec daemon that is launched and monitored by our product). Every Intersec daemon that uses the Prometheus client library is automatically registered in Prometheus using the file-based service discovery, so that it is not necessary to manually update its configuration.
Then it was time to actually implement some metrics coming from our product. We implemented the following ones, that already existed in QRRD:
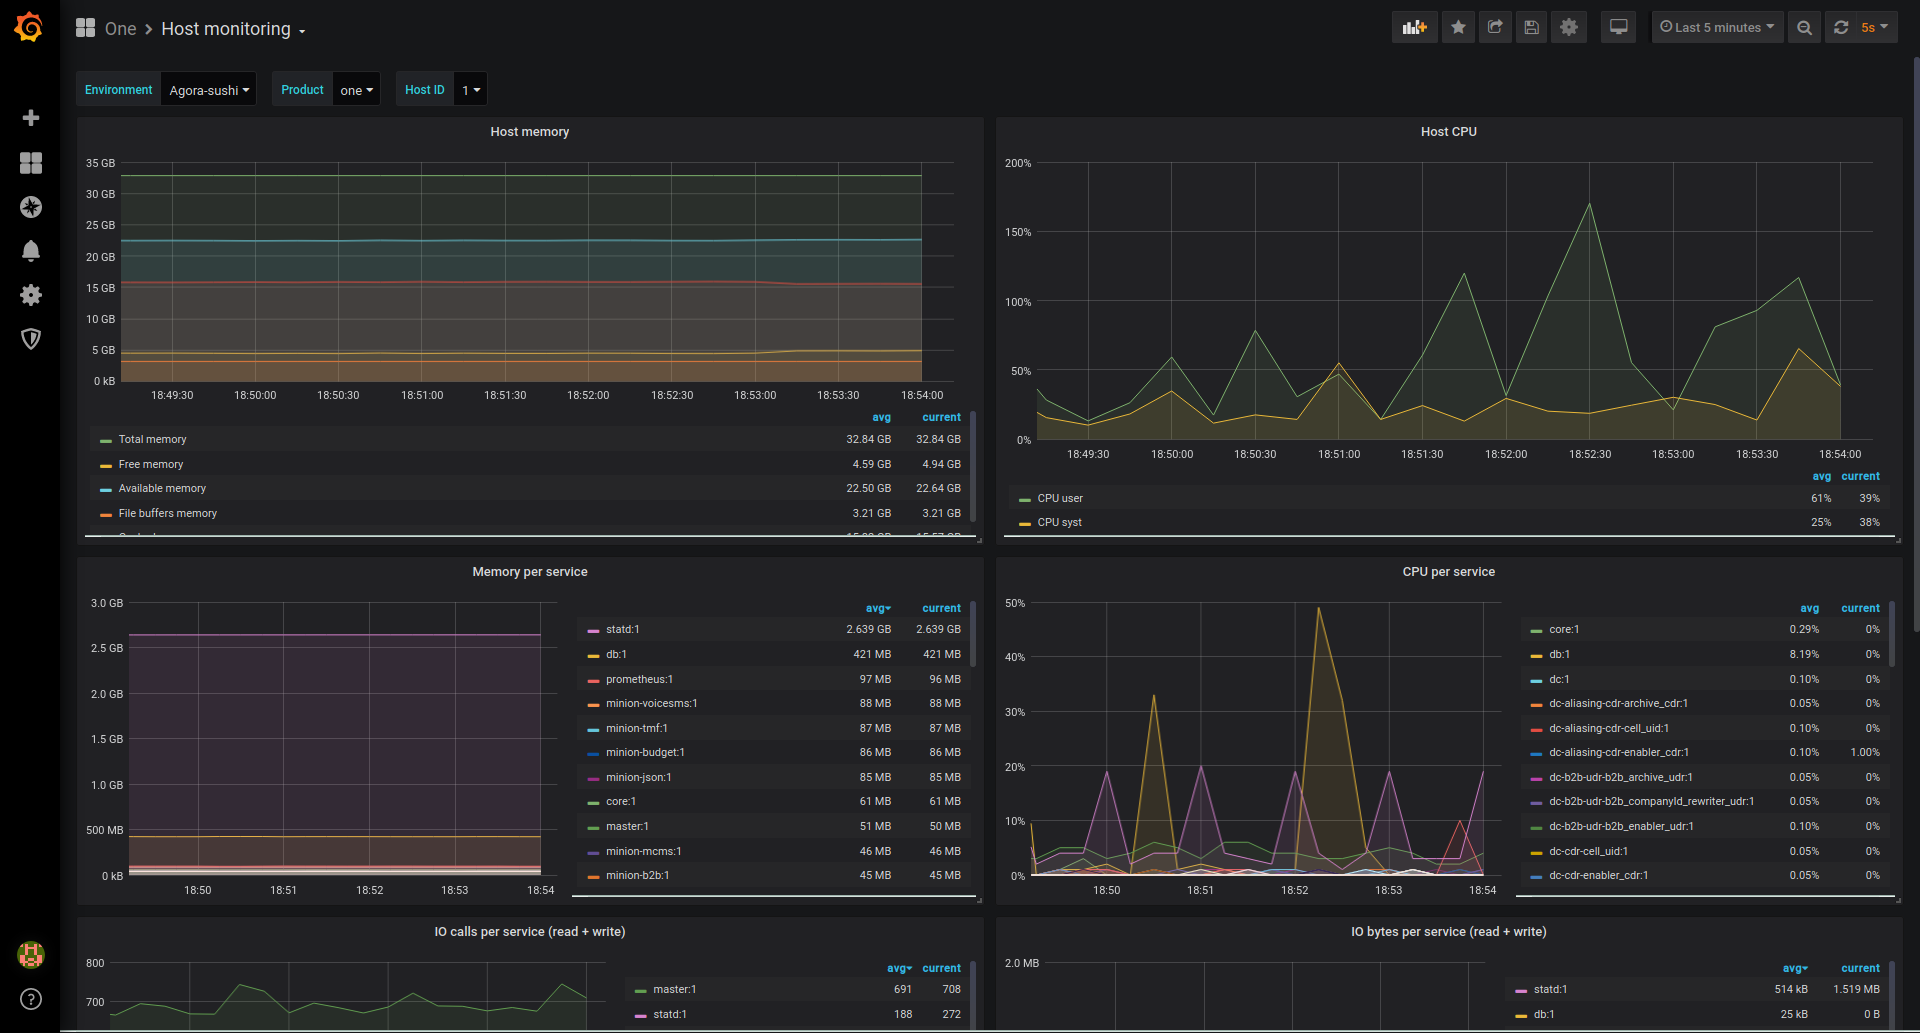
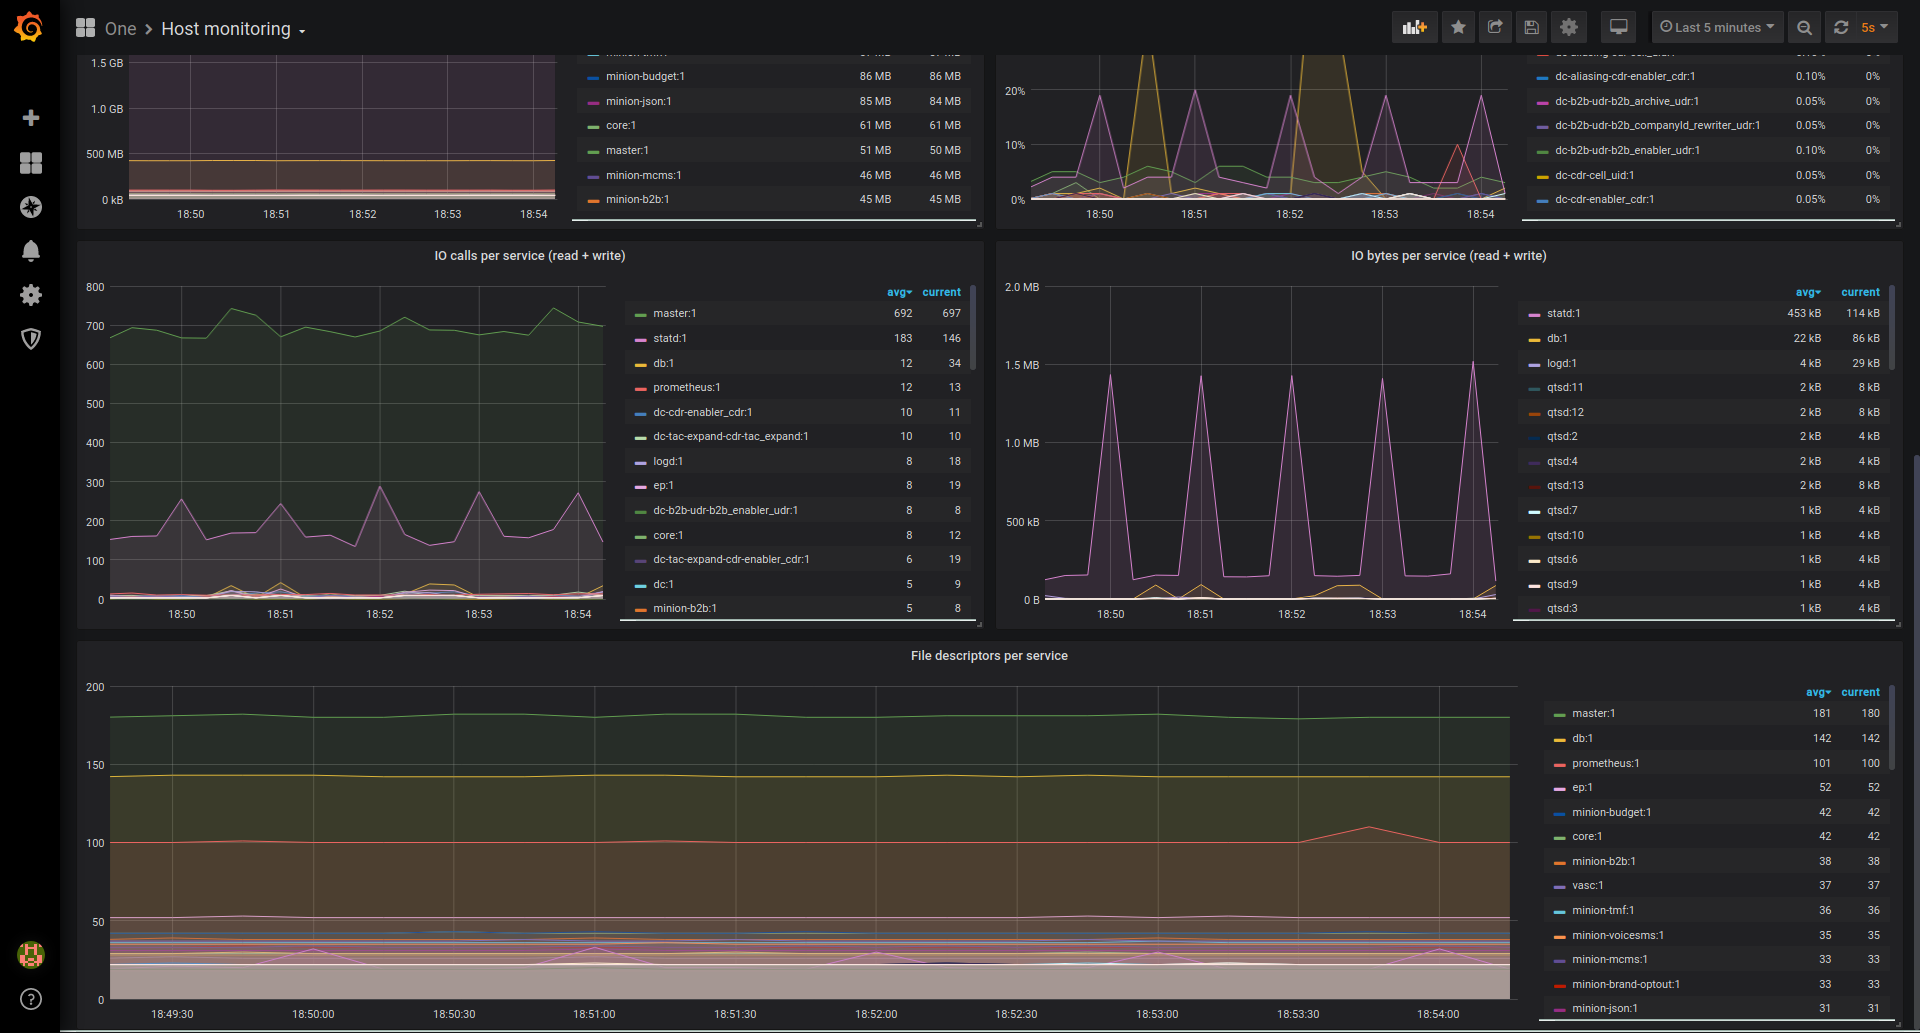
- What we call master-monitor, which is pure system metrics: CPU, memory, network, file descriptors, etc. per host and per service.
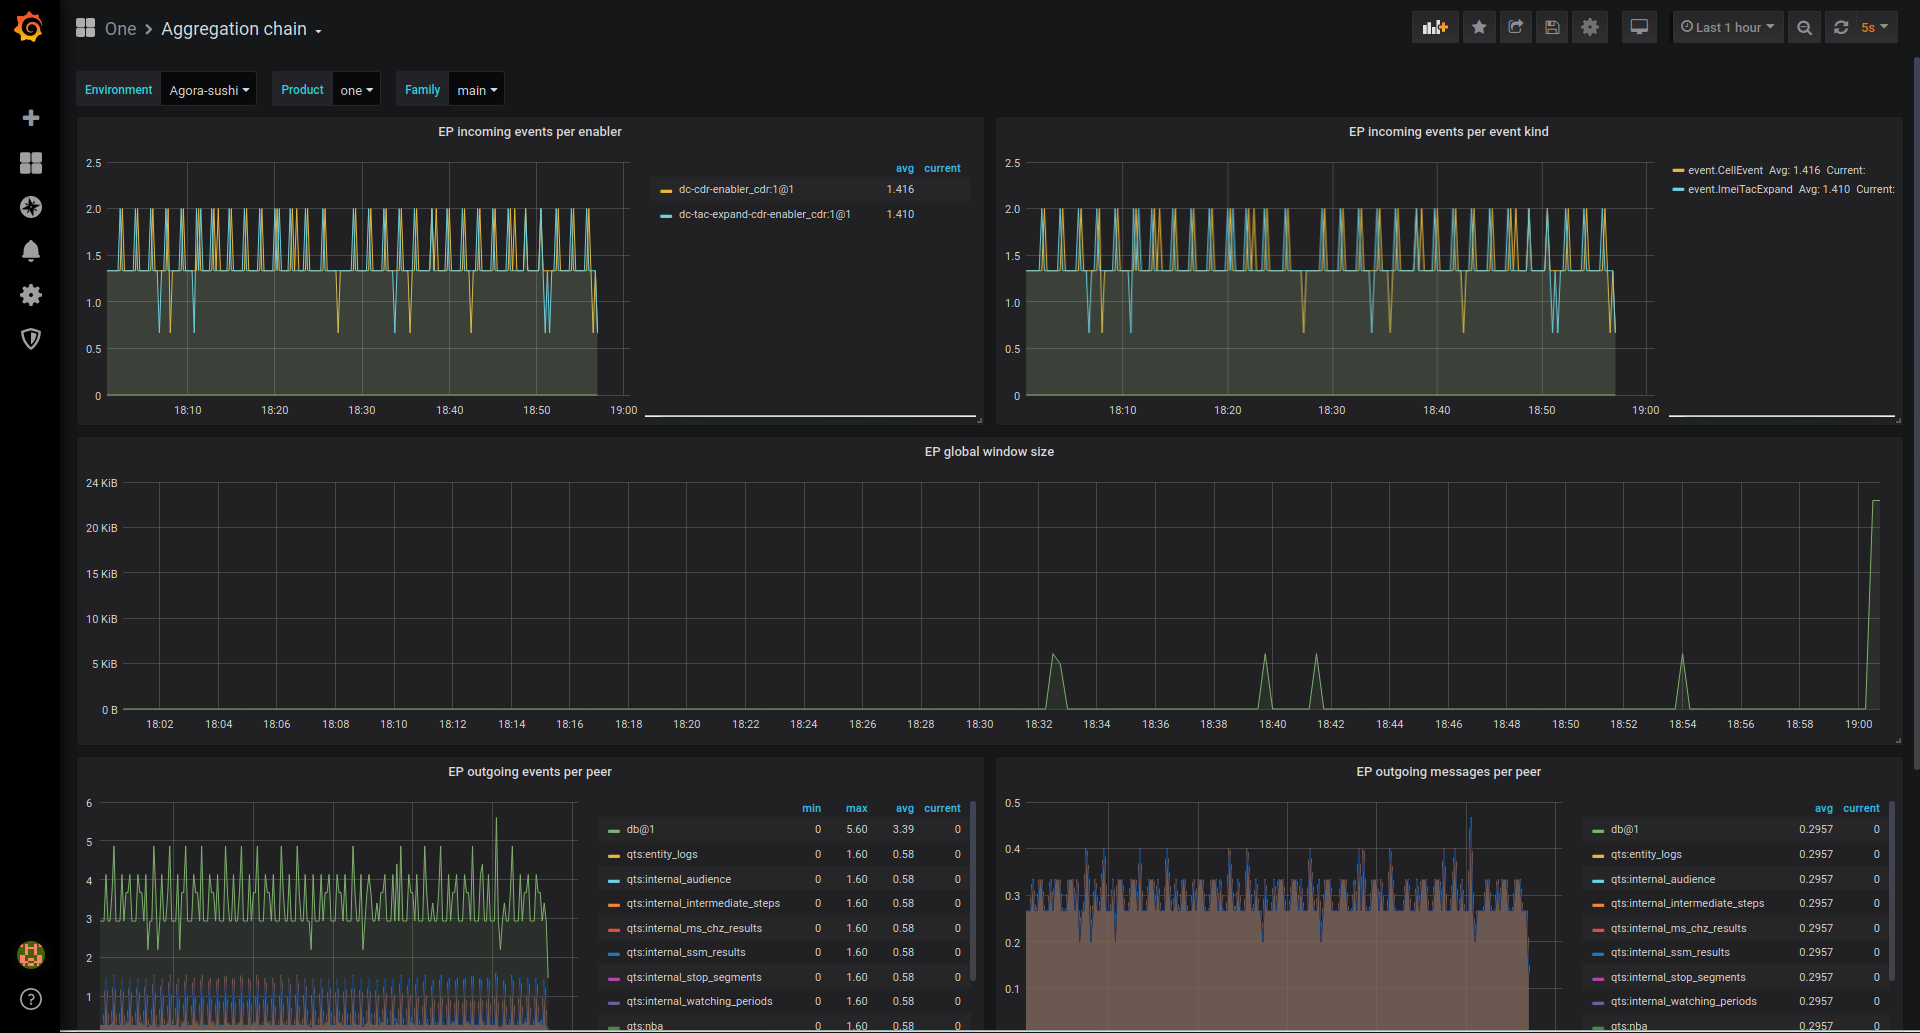
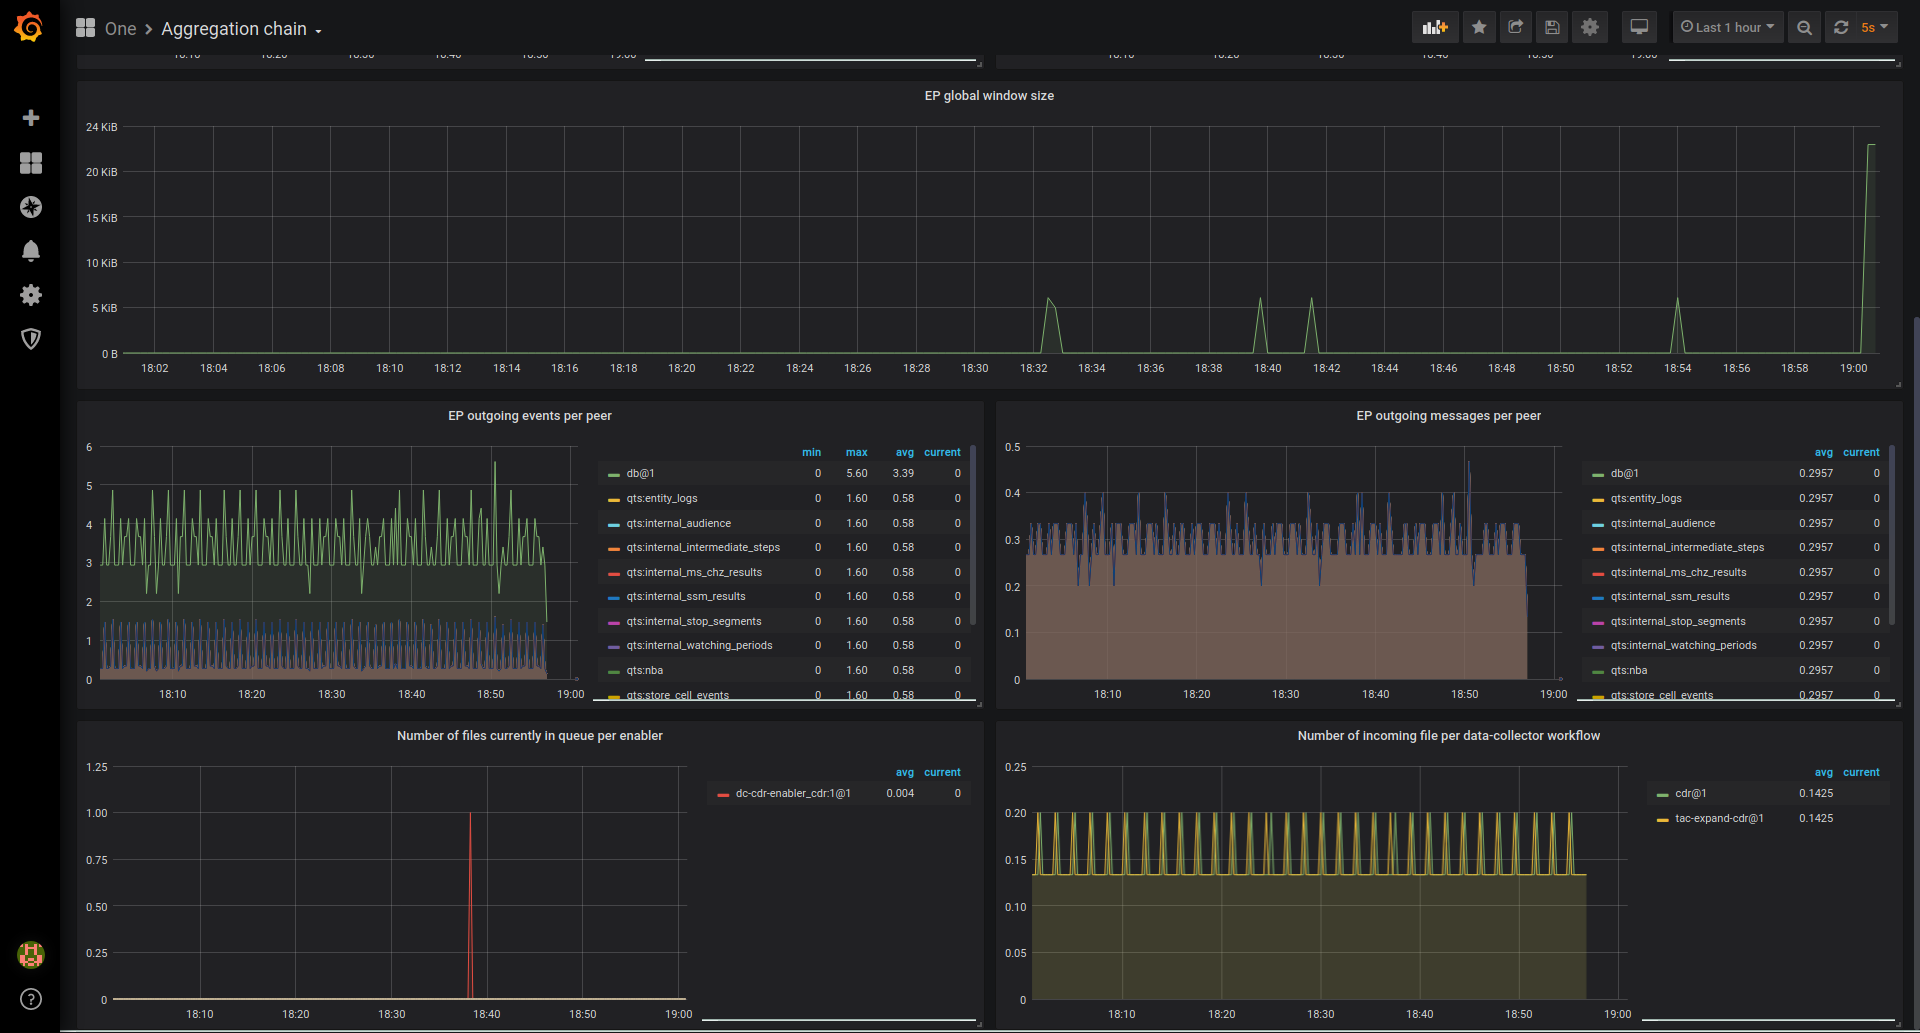
- Metrics about the aggregation chain and data-collection (i.e. incoming data to our product, and ingestion by the database): number of incoming files/events per flow, size of queues and buffers, …
- Some more “functional” metrics about scenarios: number of scenarios per state, size of the scenario schema.
Finally, we installed Grafana, connected it to the Prometheus source, and wrote some dashboards to display the produced metrics in a beautiful and useful way.
Challenges
The main challenge was to make the prometheus C client work in our code. After we integrated it in our build system, and coded dummy metrics for testing, our daemon crashed in the code of the client library as soon as Prometheus tried to scrape the metrics. We spent some time trying to understand what we had done wrong, before realizing that even the test program delivered with the C client library was crashing on our systems (at that time, we were using debian 9). We noticed that it worked fine on more recent systems, but we did not have time to upgrade our workstations. So we had to setup debian 10 containers to work on, which was pretty time-consuming.
Results
Here are screenshots of the first monitoring dashboard we built, displaying system monitoring metrics. The selectors on top of the dashboards allow to choose the platform to monitor and its host:
The second dashboard is the aggregation chain monitoring dashboard. It displays useful information about the incoming data flows in our product.
Another dashboard, showing the number of scenarios per state, along with the total size of the scenario schema:

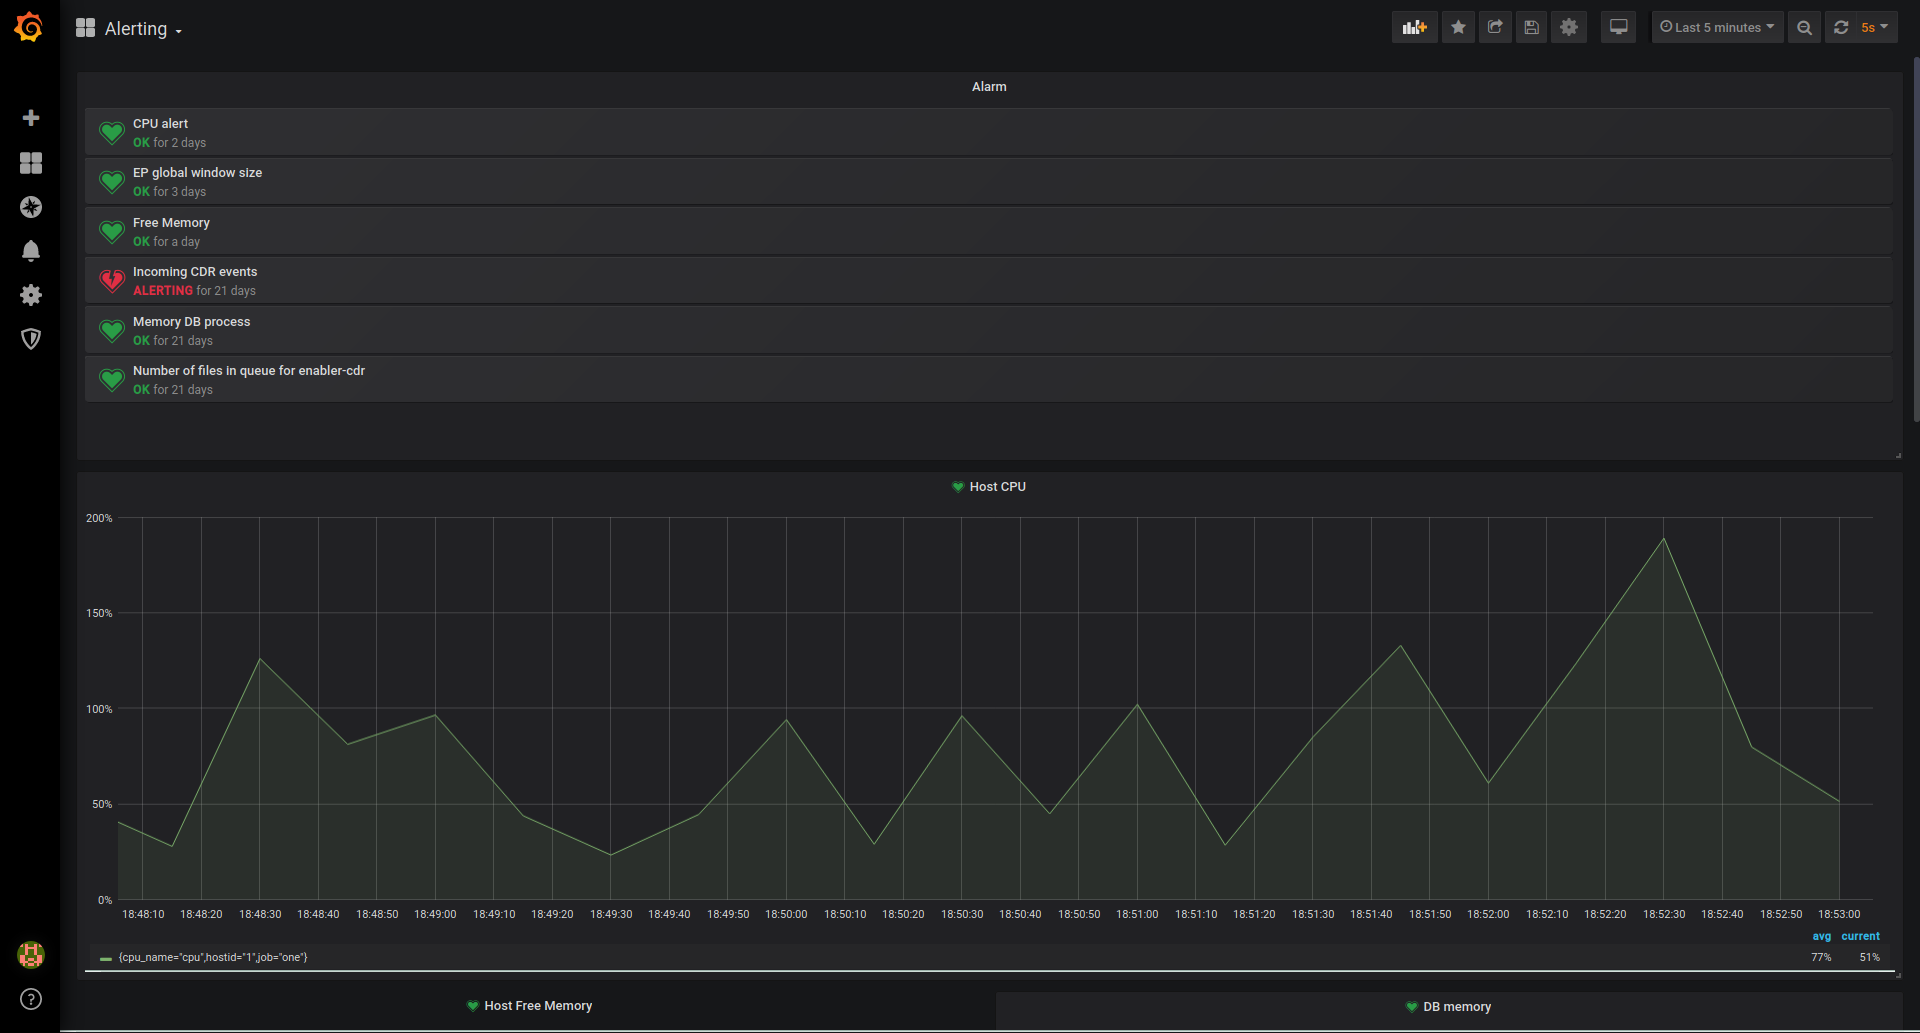
Finally, we made an alerting dashboard, that sends alerts on Slack when the CPU/RAM consumption goes too high, or when no events are received on the platform for a very long time:
Conclusion
This hackathon was the occasion to experiment another technology than QRRD to store and display monitoring time-series.
What we achieved is quite promising: Prometheus was successfully integrated in our products as a time-series database, and Grafana was used to build monitoring and alerting dashboards.
But of course, these developments are not production-ready. In order to complete them properly, we need at least to:
- Stabilize and bench the Prometheus C client; depending on the results of the bench, we might consider writing our own Prometheus client.
- Migrate more statistics to Prometheus, and build more “smart and ready-to-deploy” Grafana dashboards.
- Perform tests, write documentation and automate deployment, so that this becomes the standard monitoring solution in future versions.
