Open-source map server with Geoserver and QGIS
At Intersec we aim to provide the best user experience in our geo-oriented applications, where users need to understand a live situation at a glance and make the best decisions, based on accurate map data.
The way to achieve this goal often relies on providing just the right amount of contextual information and actions, keeping everything as simple as possible.
Users of Intersec products need to understand the geographic context:
- Demographics, transportation networks, facilities
- Environmental risks, natural and industrial threats
- Dynamic evolution of a situation, live events, forecasts
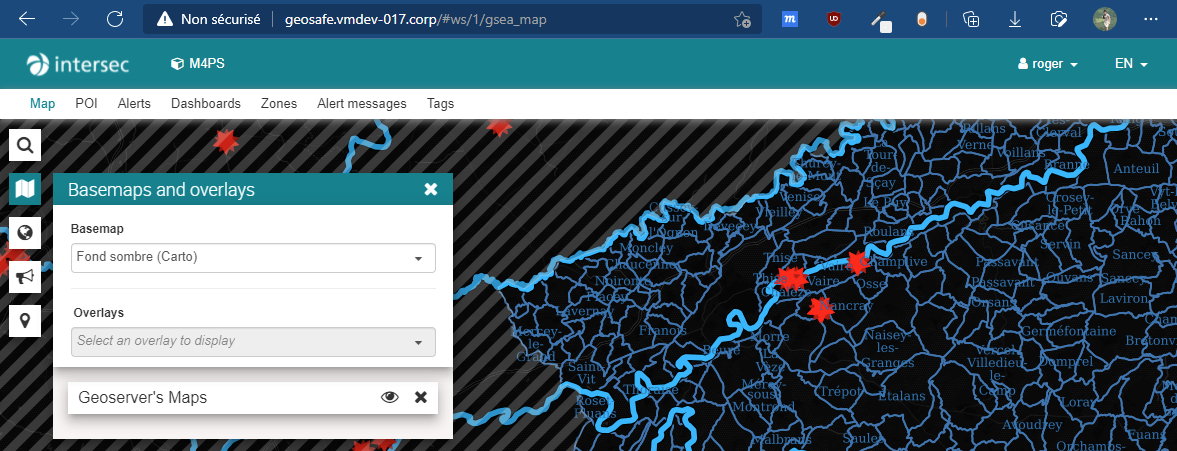
Therefore, several products in the Intersec portfolio make use of map-centric graphical user interfaces, where several cartographic layers are assembled to make a global map background, to help decision making.
Sometimes, the requested cartographic layer which would show the right information does not exist on the Internet (either as a free or paid service), nor at customer’s premises. The actual map we want needs to be built and integrated quickly. Fortunately, there seems to be some well-known open-source software blocks that might be used.
That is where this “Hackathon 0x0a” subject starts.
Introduction
When there’s no ready-to-use map service available, then someone has to build and expose these information layers, using a map server.
What is a map server?
It is a web server (HTTPs), just like the one that renders and serves the web page you are looking at right now. Instead of a web page, a map server publishes one or more cartographic “layers”, at the request of client applications or geographic information systems, in the form of “images” (i.e., raster image data, or vector data).
The role of this server is typically to transform raw big data records from databases (e.g., raw population density information per area, live weather forecast data for each city in the world, timestamped list of incidents or dangerous events, etc.) into aerial images (that is characterized by several little square images, called map tiles), ready to be shown to application users.
A map server is also able to deliver the resulting map data as a raw list of “vector features” (coordinates of points, geometries, etc.) rather than “images”, thus enabling the final application to freely handle “geographic objects” (ability to filter which ones to keep, decide how to render them in the application, provide additional interactivity). In this article we focus on maps rendered as images (aka rasterization).
For the map designer, configuring a map server to render geographic layers usually implies:
- choosing which data to keep, and which filtering to apply on the imported data sets (e.g., filter on a region, filter on a type of events/features, etc.)
- choosing which kind of visualization for each data layer (e.g., point, geometry, grid, heat-map, labels, etc.)
- choosing which style(s) to apply to the layer(s) (colors, fonts, sizes, shading, pictograms, etc.)
- testing: stacking all new layers on top of each other, in all the targeted regions in the world, at all requested zoom levels (from country/region level down to street view)
Which languages (protocols) does a map server speak?
Once configured, a map server publishes the designed maps following several kinds of standardized protocols.
The map visualization engine used by Intersec is based on the integration of the open-source library “Leaflet”, that natively supports OGC (Open Geospatial Consortium - ogc.org) standard protocols such as WMS (Web Map Service) and WMTS (Web Map Tile Service), as well as TMS (Tiled Map Service) protocol.
These OGC protocols are the most widely used by map servers and clients.
WMTS, and TMS and XYZ protocols
The “WMTS” (Web Map Tile Service) protocol is a standard defined by the OGC to describe a service for providing base maps and geographic information layers, in the form of image tiles. The WMTS protocol is sometimes generically referred to as the XYZ protocol.
The so-called generic “XYZ” servers are simple map web services, based on direct access to a tiled image via an URL, given {X, Y} components (coordinates of the tile in the matrix) and {Z} (level zoom, or depth).
Example of a URL to query one tiled image from an “XYZ” server:
http://base_url/wtms/1.0.0/tileset/{z}/{x}/{y}.png
The “TMS” (Tile Map Service) protocol is a protocol very similar to WMTS, offered by OSGeo.
The browser makes requests directly to the map server(s). The tiles that are requested depend on the current position and on the current zoom level, on the map view. These are updated during each page refresh, movement on the map, or modification of the zoom level, and according to the browser cache management.
WMS protocol
“WMS” (Web Map Service) is the other standard OGC protocol that is widely used (even more than WMTS) to provide map layers for geographic information systems (GIS) and web services.
This protocol makes it possible to further specify the image requests to the map server, in particular to ask the latter to:
- Compose the image with one or more layers of information, in a specified order (index) and with certain parameters
- Apply a chosen set of styles to each layer
- Interact with user’s clicks on the map and provide additional information on geographical features
- Etc.
WFS protocol
“WFS” (Web Feature Service) is similar to WMS and WMTS, but it does NOT do image rendering at all (rasterization, applying styles, caching tiles, etc.).
It just passes the raw mapping information (vector data) to the client, in GeoJSON for example. The client application then has to make the styling and rendering all by itself.
How-to: hackathon
The purpose of this section is to provide a high-level “How-to” guide, to help anyone interested get started quickly in designing and adding new custom map layers in a geo-oriented product.
Let’s discover a well-known map server, then a GIS application that helps design maps and publish them into map servers. Then we’ll see how to add such published maps layers to Intersec products.
Overview
Geoserver
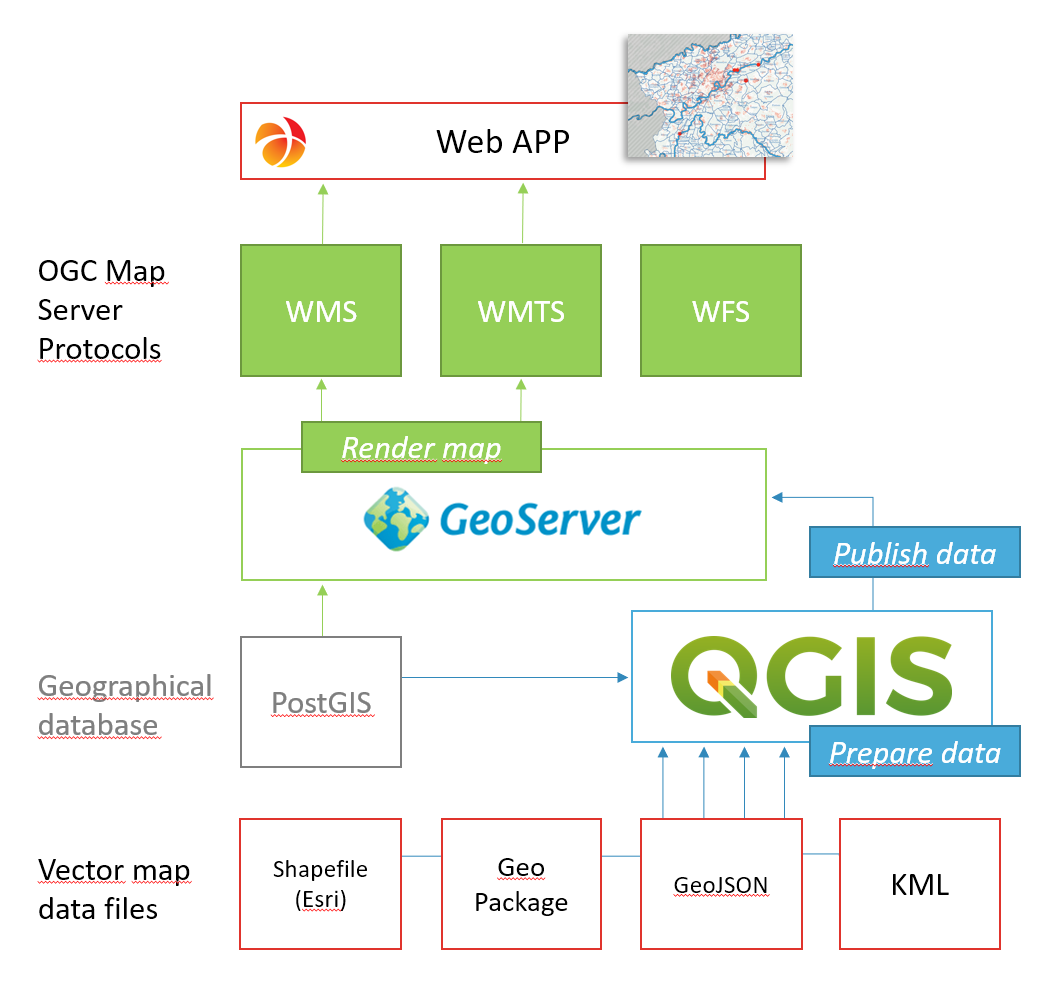
Geoserver is the most popular open-source map server (note: MapServer is almost as famous as Geoserver… more complex to start with though); it is written in java.
It allows to host custom map overlays for products like GeoSafe CM or GeoSafe LI, without the need to subcontract with other partners to bring these additional maps in the mix.
In many cases, it is easy to expose such layers using Geoserver, starting with raw data from files, like CSVs, JSON/GeoJSON, Esri’s Shapefile, KML, GeoPackages. We call these “geospatial file formats”, or “GIS file formats”.
Many governmental and non-governmental open data sources come in these geospatial file formats (most often as Shapefiles or GeoJSON).
Note that map servers (including Geoserver) are also tailored to work with real databases (rather than files), especially geo-oriented databases like PostGIS, which enable advanced support for data formats required by geographic information systems as well as efficient querying methods and languages.
The idea now is to have such Geoserver installed and running along with an Intersec GeoSafe CM (Crisis Manager) instance (for example).
GeoSafe CM can be configured to provide additional map layers to its users via local or external map servers.
Installing Geoserver
-
Unpack it
-
[optional] Install it into proper directories on the platform.
Configuration
In order to run well with secured web apps that are not hosted on the same domain as Geoserver, you may need to do the following modification in Geoserver configuration: enabling CORS (Cross-origin resource sharing) support to allow map tiles loading into the client app.
Edit the webapps/geoserver/WEB-INF/web.xml file. There are two
references to CORS in this file:
<!-- Uncomment following filter to enable CORS --> <filter>
<filter-name>cross-origin</filter-name>
<filter-class>org.eclipse.jetty.servlets.CrossOriginFilter</filter-class>
</filter>
and
<!-- Uncomment following filter to enable CORS --> <filter-mapping>
<filter-name>cross-origin</filter-name> <url-pattern>/*</url-pattern>
</filter-mapping>
You must uncomment both blocks (that is remove from the filter and filter-mapping blocks.
Running Geoserver
-
[dependency] install JRE; for example, on debian-based, if not installed yet:
#apt install default-jre -
Start the server:
geoserver$ bin/startup.sh -
[optional] open the GUI
http://127.0.0.1:8080/geoserver/
Default admin credentials:
login: admin
password: geoserver
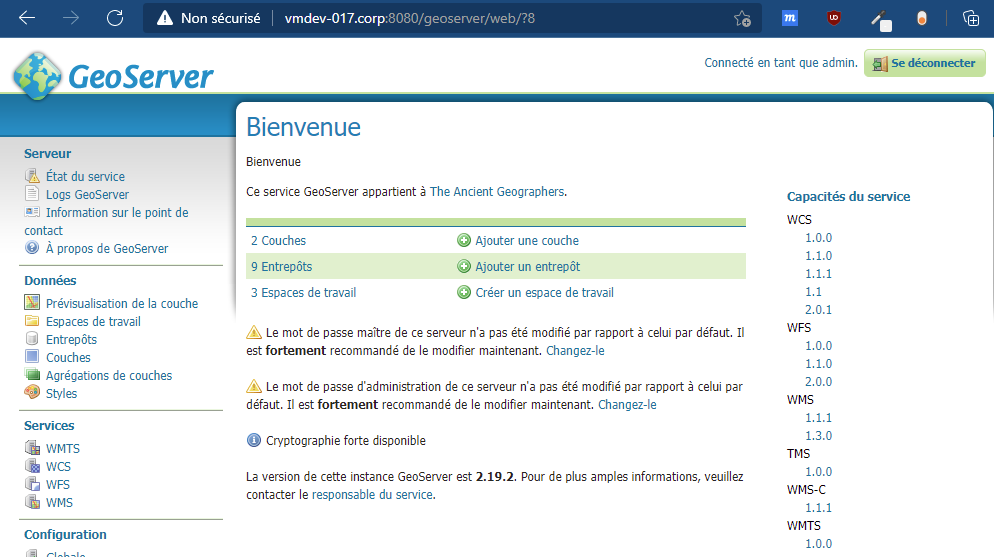
Now that you have a running Geoserver, it’s time to load custom map layers in it.
QGIS
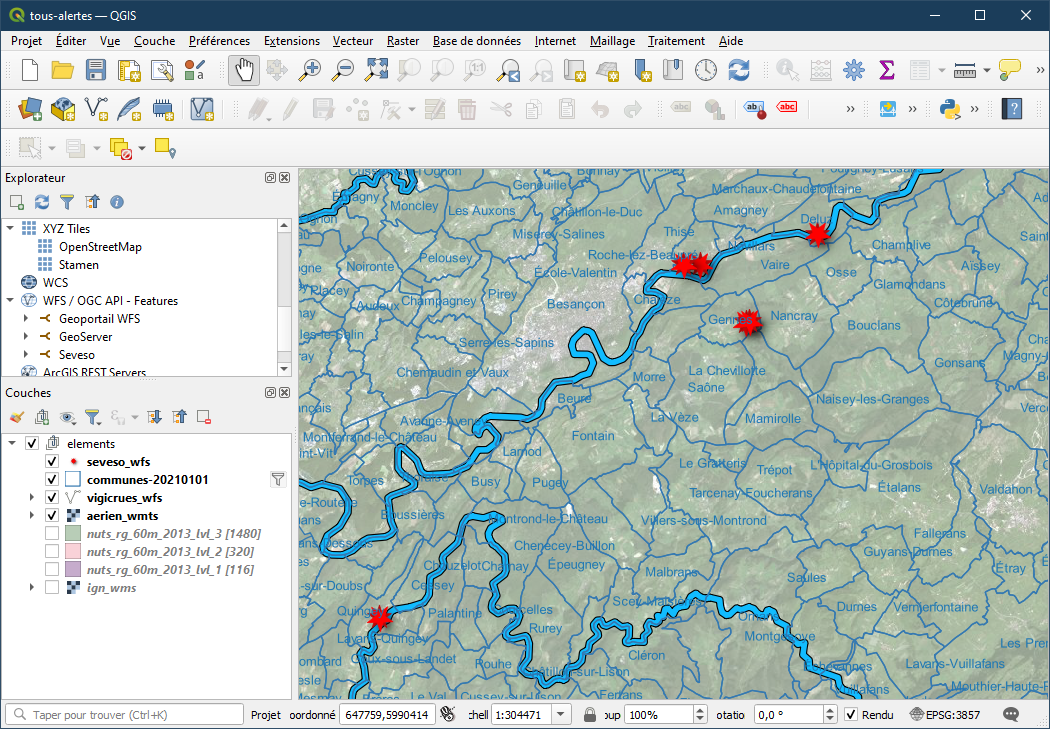
QGIS is the most famous open-source GIS (Geographic Information System) to consider working with.
It is a rather light full desktop application available on Linux, MacOS and Windows. You can use it to build map layers, in a visual and user-friendly environment.
Any kind of data source can be imported and “drawn” on the map space:
- GeoJSON, Shapefile, KML, GeoPackage, etc.
- any flat file (local, remote/URL) containing coordinates and other metadata
- existing map services from local or remote servers (WMS, WMTS, WFS etc.)
- local or remote databases (PostGIS, …)
Once some layers are created and customized (colors, pictograms, shapes, fills, transparency, etc.), the project can be saved and:
- exported as Geoserver-ready files (like GeoPackage) or
- dynamically published to a running map server (like MapServer, Geoserver or ArcGIS) thanks to some QGIS extensions
QGIS’ “GeoCat Bridge” plugin
This QGIS extension is the simplest way to “push” layers built within QGIS into a running instance of Geoserver. GeoCat Bridge is available as an official plugin for QGIS 3.10+, directly installable from the “Plugins” menu.
Once installed the GeoCat Bridge plugin, you just have to:
- open the plugin dialog box via
“Internet” -> “GeoCat Bridge” -> “Publish” - (first time) set the URL of your new Geoserver (like
“http://<dest_platform>:8080/geoserver”) - (first time) set the authentication method and credentials for your server (default: basic authentication)
- next, choose which layers from the QGIS project you want to publish
- then publish


Intersec product configuration
We usually prefer to use the WMS protocol to connect to Geoserver, which is enabled by default on any new Geoserver installation, running at the following WMS Resource URL:
http://dest_platform:8080/geoserver/namespace/wms
Note: if you used QGIS to publish your maps, then the namespace corresponds to the name of the layers in your QGIS project.
This URL is used by the client app (like an Intersec GeoSafe app) to perform requests such as:
- GetCapabilities: read which layers are available, and which styles and visualization parameters can be applied to each layer
- GetMap: request to download one tiled map image from a specified layer and style, at a given point (x,y,z) on the grid
- GetFeatureInfo: request additional information (metadata) of geographic feature (shape, etc.) relative to a given clicked point (x,y) on the rendered map
Adding the map layer configuration
The configuration of the map servers in the product is done through YAML description. The technical administrator declares the maximum set of base maps and overlays that can be used in the product. Each cartographic layer is defined in the configuration file by:
- The name of the cartographic layer
- The URL of the WMS/WMTS/XYZ/TMS server
- The API key issued by the supplier (if applicable)
- Any other specific key/values required by the server (styles, additional authentication, etc.)
The following kind of entry should be added:
  - name: "Geoserver's Maps"
    url: "http://vmdev-017.corp:8080/geoserver/tous-alertes/wms"
    attribution: "Intersec labs"
    parameters:
      - key: layers
        value: communes-20210101,vigicrues_wfs,seveso_wfs
In this example, the map server is specifically asked to compose an image with several layers, in a precise order (from “bottom” to “top”): communes, vigicrues, seveso. The layers requested from the server are concatenated in a character string separated by commas and specified in the layers parameter. The “bottom” layer in the stack is the “leftmost” layer in the string.
